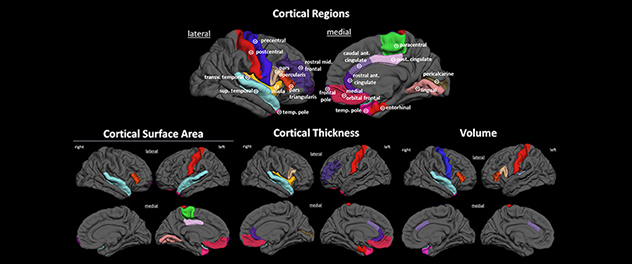
 Cortical regions
Brain regions that comprise the chronic migraine versus episodic migraine classifiers are illustrated.
Projects
The Neuroimaging of Headache Disorders Laboratory uses multimodal brain imaging techniques to identify imaging biomarkers for the diagnoses of migraine and concussion and for prognosticating clinical outcomes and recovery. Specifically, the lab focuses on the following research areas.
Pathophysiology of migraine and concussion
To study the shared and distinct pathophysiology of migraine and concussion, the lab uses:
- T1-weighted magnetic resonance imaging (MRI) to determine cortical thickness, regional volumes and cortical surface area.
- Diffusion tensor imaging to investigate white matter tract integrity.
- Resting-state functional connectivity analyses to determine brain functional organization.
- Event-related functional magnetic resonance imaging (fMRI) to investigate brain processing of sensory stimuli
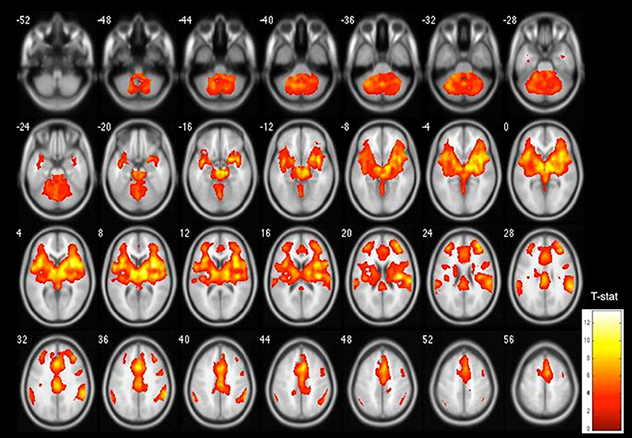 Heat-induced activation patterns
Noxious heat-induced functional activation patterns in patients with migraines and healthy controls are shown.
Related areas include:
- Pain processing in migraine. To better understand whether pain processing is altered in patients with migraine or affected by migraine-specific factors, such as headache frequency, years lived with migraine and time to next headache, quantitative sensory testing is performed to measure pain thresholds and pain tolerance thresholds. Quantitative sensory testing results also are used to determine temperatures required to elicit moderate-intensity pain while participants undergo fMRI.
- Alterations in brain structure and function due to migraine. The lab is investigating whether alterations in brain structure or function relate to migraine burden, such as headache frequency and number of years with migraine, as well as clinical factors such as symptoms of allodynia and photophobia.
Brain injury and recovery patterns in concussion
The lab is elucidating the structural and functional brain injury and recovery patterns following concussion to better understand whether injury and recovery patterns differ between sexes.
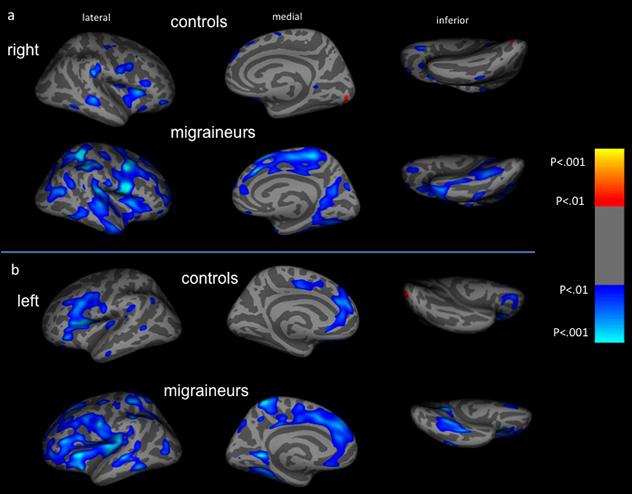 Atypical cortical thinning
Atypical age-related cortical thinning in migraine patients is shown.
Predictive modeling of disease states and brain biomarker research
The diagnoses of concussion and migraine largely rely on patients' self-reported symptoms being consistent with diagnostic criteria determined via expert consensus. An objective biomarker for these diagnoses would help refine diagnostic criteria.
The lab uses statistical multivariate modeling techniques based on structural and functional imaging data to classify patients from healthy controls. Furthermore, the lab is building models that enable the accurate classification of migraine subtypes, such as episodic and chronic migraine. The lab also is building models that distinguish patients who have migraine from patients with post-traumatic headache and other headache disorders based solely on brain MRI data.
Studying the effects of medication on the brain
The focus of this area of research is on the impact of preventive migraine medication on pain-induced activation of the migraine brain. The lab is using MRI to study the changes in brain function and structure that correlate with clinical response to a CGRP monoclonal antibody.
 Cortical thickness correlations
Ventral diencephalon volume to vertex-by-vertex cortical thickness correlations shown for control group of patients with migraine and cluster headache.