Services
The Mayo Clinic Spatial Biology Core's service lines include:
- Conventional nCounter analysis to determine RNA abundance.
- GeoMx Digital Spatial Profiling platform to determine protein and RNA abundance.
- CosMx Spatial Molecular Imaging platform for single cell spatial analysis of RNA and protein.
The facility has three GeoMx instruments, three nCounter digital analyzers and four sample preparation systems. Two CosMx Spatial Molecular Imaging platforms are in use.
The facility's team is open to talking about future collaborations that need single-cell spatial analysis of protein and RNA. Team members see themselves as collaborators rather than providers of core services. The facility is committed to working closely with collaborators on early-stage design of spatial biology analyses.
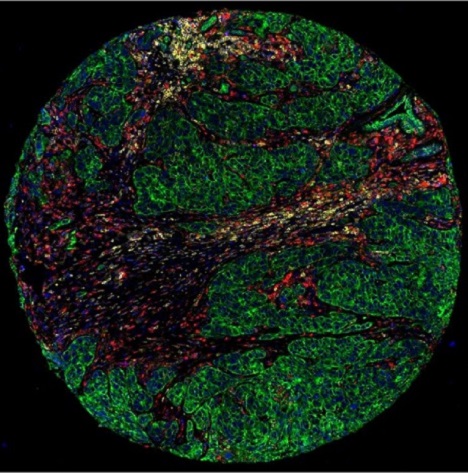
A triple-negative breast cancer sample is stained with immunofluorescent antibodies. Cytokeratin, which visualizes tumor cells, is shown in green. CD45, which visualizes white blood cells that protect the body from infection, is shown in yellow. CD68, which visualizes macrophages, which play a major role in tumor cell recognition by the immune system, is shown in red. Nuclei were stained blue with SYTO 13. The samples were incubated with antibodies or hybridization probes, each linked by a UV-labile cross-linker to a unique synthetic oligodeoxyribonucleotide. The oligonucleotides are barcodes for the target-specific proteins or transcripts.
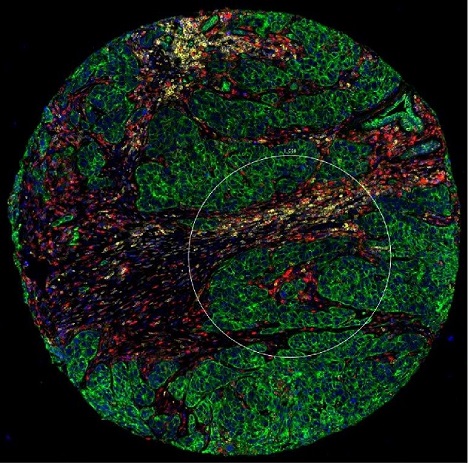
The 600-micron region of interest marked with a white circle includes green tumor cells that are cytokeratin-positive and red (macrophage) and yellow (white blood) stromal cells that are cytokeratin-negative.
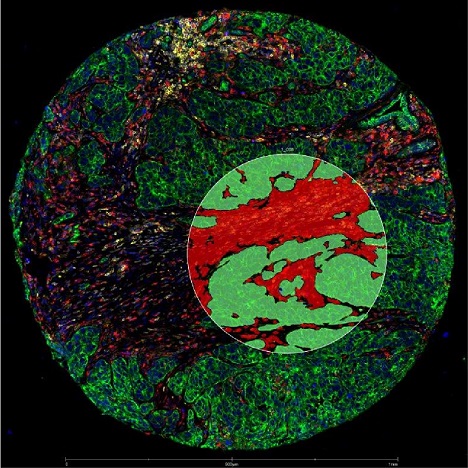
Computer-generated "masks" guide UV laser illumination of these niches: tumor, shown as green (cytokeratin-positive) and stroma shown as red (cytokeratin-negative). These niches were illuminated sequentially to release target-bound oligonucleotides. Then these oligonucleotides were quantified by nCounter or next-generation sequence analysis.