Services
Core research services are grouped into specialized service lines that provide access to expertise in specimen processing, biomolecular analysis, molecular development, imaging, structural testing, tissue analysis and data analytics. The core strives to provide full-service support for single-cell phenotyping assays from pathology specimens to single-cell suspensions.
Service lines include:
- Mass cytometry-cytometry by time of flight (CyTOF) using the Helios instrument.
- Custom heavy metal conjugation of antibodies through collaboration with the Antibody Hybridoma Core, which allows the generation of panels with 40 or more markers.
- Cell sample preparation for CyTOF-mass cytometry experiments.
- Custom CyTOF and imaging mass cytometry panel design.
- Access to predesigned human and mouse mass cytometry-CyTOF panels.
- Slide preparation for the Hyperion imaging system through collaboration with the Pathology Research Core.
- Access to a prevalidated Hyperion imaging panel.
- Imaging mass cytometry using the Hyperion imaging system.
- Slide preparation and data acquisition using the Akoya Fusion-Phenocycler imaging system.
Mass cytometry
Helios CyTOF system
CyTOF is a high-parameter single-cell analysis technology that is similar to flow cytometry. Rather than detecting fluorescent signals as in flow cytometry, mass cytometry detects heavy metal labeled antibodies through time-of-flight inductively coupled mass spectrometry.
This detection method allows investigators to interrogate over 40 unique antibody markers in a single CyTOF run. It is a valuable tool for immune phenotyping, monitoring intracellular cytokines and detecting unique signaling intermediates through detection of phospho-proteins. Data output files use the flow cytometry standard (.fcs), so analysis can be performed with tools routinely used for flow cytometry.
Multiparameter spatial imaging
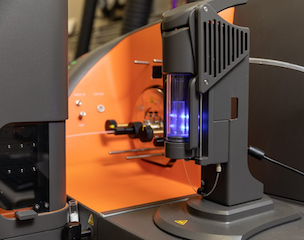
Hyperion imaging system
The Immune Monitoring Core uses Standard BioTools Helios CyTOF technology and provides services using the Standard BioTools Hyperion Imaging System. Mass cytometry technology using Helios CyTOF enables a comprehensive understanding of cell phenotypes, signaling pathways and function.
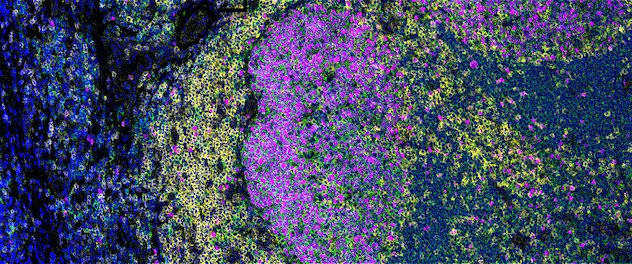 High-plex pseudo-colored image
A normal human tonsil is stained with a 24-antibody panel to detect immune cells and structural proteins. This image was generated post-acquisition using MCD Viewer software designed for visualizing, reviewing and exporting mass cytometry data. The pseudo-colored image above highlights four unique cellular markers, with nuclei in blue, CD20-positive B cells in green, CD3-positive T cells in yellow and the proliferation marker Ki-67 in magenta. Other markers not represented here allow for the identification of additional cell subsets, differentiation states and structural features.
Phenocycler-Fusion multiparameter spatial imaging
The Akoya Phenocycler-Fusion imaging system is a multiplexed immunofluorescence imaging system that can identify 100 or more unique protein markers in tissue. This system uses oligonucleotide bar-code-labeled antibodies to detect tissue markers. Through cyclic hybridization of unique complementary fluorescent probes and image scanning, investigators can generate high-resolution multiplexed images. Downstream bioinformatics analysis, including cell segmentation, cell classification, nearest neighbor determination and cellular network identification, allows investigators to further determine and identify complex spatial relationships between multiple cell types identified in their target tissue.
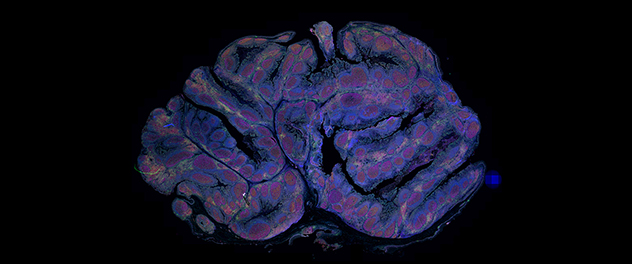 Whole-slide tissue scan
Image scanning and post-acquisition stitching allows for the generation of a whole-slide high-resolution image. The panoramic image above is pseudo-colored to identify immune cell subsets, including macrophages, B cells and T cells. Additional markers are used to identify nuclei and proliferating cells.
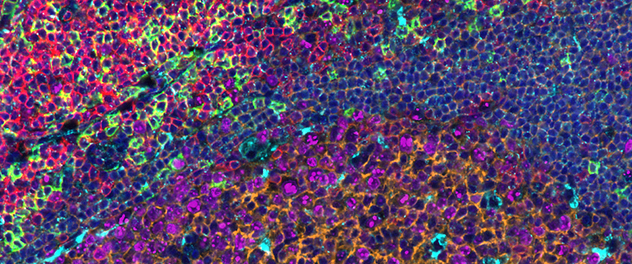 Magnified high-resolution image
The magnification of whole-slide scans allows for the identification of cell subsets and histologic features. This image clearly identifies CD3+ T cells in red, CD20+ B cells in orange and CD8+ T cells in green. In addition, the degranulation marker CD107a is highlighted in cyan and nuclei are in blue.